Modèle:Infobox Election Hudson 2012 : Différence entre versions
Un article de WikiSimland 3.0.
(Page créée avec « {| class="toccolours" width="340" style="float:right;margin: 0em 0em 0em 1em;" |- | colspan="2" align="center" valign="middle" height="50"; font-size: 1em; background: #; ... ») |
|||
| Ligne 48: | Ligne 48: | ||
|[[Image:PLH-2012.png|50px]] | |[[Image:PLH-2012.png|50px]] | ||
|- | |- | ||
| − | | <font size="2"> {{Barre pourcentage 2|couleur-bande=#4683bf|couleur-texte=#FFFFFF|pourcentage=17|ratio-1=17.1%|ratio-2= | + | | <font size="2"> {{Barre pourcentage 2|couleur-bande=#4683bf|couleur-texte=#FFFFFF|pourcentage=17|ratio-1=17.1%|ratio-2=}} |
|- | |- | ||
| colspan="2" style="text-align: center; border-top: #f9f9f9 solid 1px;" | ''' ''' | | colspan="2" style="text-align: center; border-top: #f9f9f9 solid 1px;" | ''' ''' | ||
| Ligne 57: | Ligne 57: | ||
|[[Image:PRD-2012.png|50px]] | |[[Image:PRD-2012.png|50px]] | ||
|- | |- | ||
| − | | <font size="2"> {{Barre pourcentage 2|couleur-bande=#2493ca|couleur-texte=#FFFFFF|pourcentage=8|ratio-1=8.3%|ratio-2= | + | | <font size="2"> {{Barre pourcentage 2|couleur-bande=#2493ca|couleur-texte=#FFFFFF|pourcentage=8|ratio-1=8.3%|ratio-2=}} |
|- | |- | ||
| colspan="2" style="text-align: center; border-top: #f9f9f9 solid 1px;" | ''' ''' | | colspan="2" style="text-align: center; border-top: #f9f9f9 solid 1px;" | ''' ''' | ||
| Ligne 66: | Ligne 66: | ||
|[[Image:HS-2012.png|50px]] | |[[Image:HS-2012.png|50px]] | ||
|- | |- | ||
| − | | <font size="2"> {{Barre pourcentage 2|couleur-bande=#ee7d51|couleur-texte=#FFFFFF|pourcentage=6|ratio-1=5.8%|ratio-2= | + | | <font size="2"> {{Barre pourcentage 2|couleur-bande=#ee7d51|couleur-texte=#FFFFFF|pourcentage=6|ratio-1=5.8%|ratio-2=}} |
|- | |- | ||
| colspan="2" style="text-align: center; border-top: #f9f9f9 solid 1px;" | ''' ''' | | colspan="2" style="text-align: center; border-top: #f9f9f9 solid 1px;" | ''' ''' | ||
| Ligne 75: | Ligne 75: | ||
|[[Image:PVH-2012.png|50px]] | |[[Image:PVH-2012.png|50px]] | ||
|- | |- | ||
| − | | <font size="2"> {{Barre pourcentage 2|couleur-bande=#98c352|couleur-texte=#FFFFFF|pourcentage=4|ratio-1=3.7%|ratio-2= | + | | <font size="2"> {{Barre pourcentage 2|couleur-bande=#98c352|couleur-texte=#FFFFFF|pourcentage=4|ratio-1=3.7%|ratio-2=}} |
|- | |- | ||
| colspan="2" style="text-align: center; border-top: #f9f9f9 solid 1px;" | ''' ''' | | colspan="2" style="text-align: center; border-top: #f9f9f9 solid 1px;" | ''' ''' | ||
| Ligne 91: | Ligne 91: | ||
! colspan="2" align="center" |[[Fichier:Sieges-HU-2012.png|280px]] | ! colspan="2" align="center" |[[Fichier:Sieges-HU-2012.png|280px]] | ||
|- | |- | ||
| + | | colspan="2" style="text-align: center; border-top: #E3E3E3 solid 1px;" | ''' ''' | ||
| + | |- | ||
| + | | colspan="2" align="center" | [http://www.simland.eu/forum/archives-etat/etat-election-generale-hudsonienne-2012-t14824.html Sujet de l'élection] | ||
|} | |} | ||
Version actuelle en date du 10 janvier 2016 à 22:18
| ← 2010 | |
| Election générale hudsonoise de 2012 | |
|---|---|
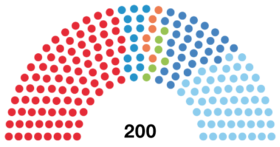
| 200 sièges à la Diète d'Etat 101 sièges nécessaires pour la majorité absolue | |
| 7 octobre 2012 | |
| Electeurs inscrits | 8'308'825 |
| Participation | |
| 64.6% |
▼ 6.2 pts |
| Résultats | |
| Parti socialiste hudsonois – David Nilson 1'873'258 voix 88 sièges |

|
| 34.9% | |
| Parti hudsonois – Frank Jarett 1'674'660 voix 54 sièges |

|
| 31.2% | |
| Parti libéral hudsonois – Jeanne Mai 917'843 voix 32 sièges |

|
| 17.1% | |
| Parti radical démocratique – John Wyann 445'503 voix 14 sièges |

|
| 8.3% | |
| Hudson solidaire – Martine Fraicheur 311'315 voix 6 sièges |

|
| 5.8% | |
| Parti vert hudsonois – Quentin Calmant 198'597 voix 6 sièges |

|
| 3.7% | |

| |
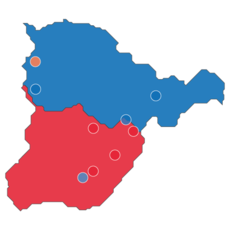
| Parti arrivé en première position dans les districts et les villes | |
| Diète d'Etat | |

| |
| Sujet de l'élection | |